Students can download 12th Business Maths Chapter 7 Probability Distributions Ex 7.4 Questions and Answers, Samacheer Kalvi 12th Business Maths Book Solutions Guide Pdf helps you to revise the complete Tamilnadu State Board New Syllabus and score more marks in your examinations.
Tamilnadu Samacheer Kalvi 12th Business Maths Solutions Chapter 7 Probability Distributions Ex 7.4
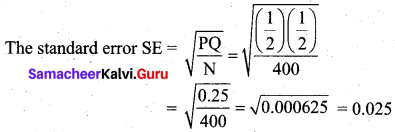
Choose the correct answer:
Question 1.
Normal distribution was invented by ______
(a) Laplace
(b) De-Moivre
(c) Gauss
(d) all the above
Answer:
(b) De-Moivre
Question 2.
If X ~ N (9, 81) the standard normal variate Z will be ______
(a) Z = \(\frac{x-81}{9}\)
(b) Z = \(\frac{X-9}{81}\)
(c) Z = \(\frac{X-9}{9}\)
(d) Z = \(\frac{9-x}{9}\)
Answer:
(c) Z = \(\frac{X-9}{9}\)
Hint:
µ = 9, σ = 9
Z = \(\frac{X-9}{9}\)
![]()
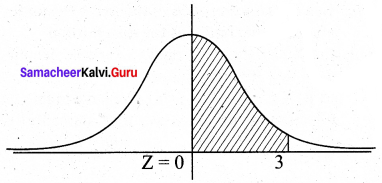
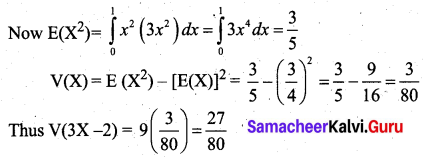
Question 3.
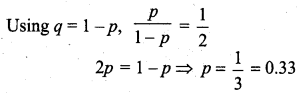
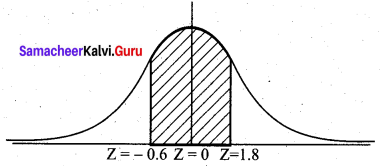
If Z is a standard normal variate, the proportion of items lying between Z = -0.5 and Z = -3.0 is ________
(a) 0.4987
(b) 0.1915
(c) 0.3072
(d) 0.3098
Answer:
(c) 0.3072
Hint:
P(-0.5 < Z < -3)
By symmetry we want P (0.5 < Z < 3)
= P(0 < Z < 3) – P(0 < Z < 0.5)
= 0.49865 – 0.1915
= 0.30715 ~ 0.3072
Question 4.
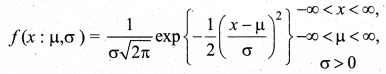
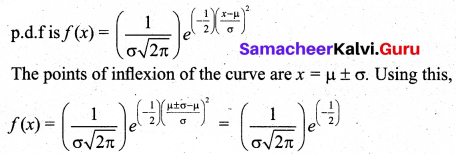
If X ~ N(µ, σ2), the maximum probability at the point of inflexion of normal distribution is ______
(a) \(\left(\frac{1}{\sqrt{2 \pi}}\right) e^{\frac{1}{2}}\)
(b) \(\left(\frac{1}{\sqrt{2 \pi}}\right) e^{\left(-\frac{1}{2}\right)}\)
(c) \(\left(\frac{1}{\sigma \sqrt{2 \pi}}\right) e^{\left(-\frac{1}{2}\right)}\)
(d) \(\left(\frac{1}{\sqrt{2 \pi}}\right)\)
Answer:
(c) \(\left(\frac{1}{\sigma \sqrt{2 \pi}}\right) e^{\left(-\frac{1}{2}\right)}\)
Hint:
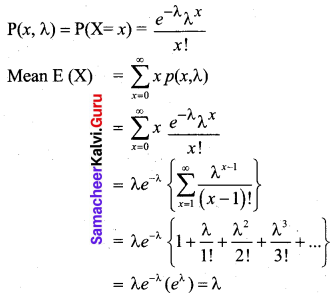
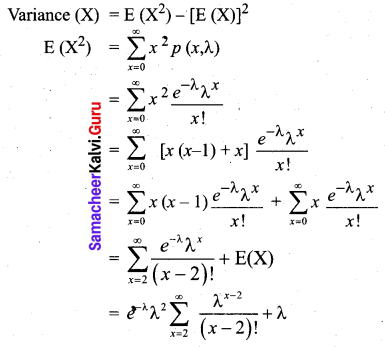
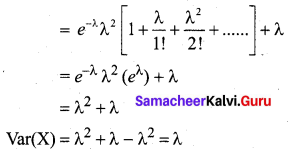
Question 5.
In a parametric distribution the mean is equal to variance is ________
(a) binomial
(b) normal
(c) Poisson
(d) all of the above
Answer:
(c) Poisson
![]()
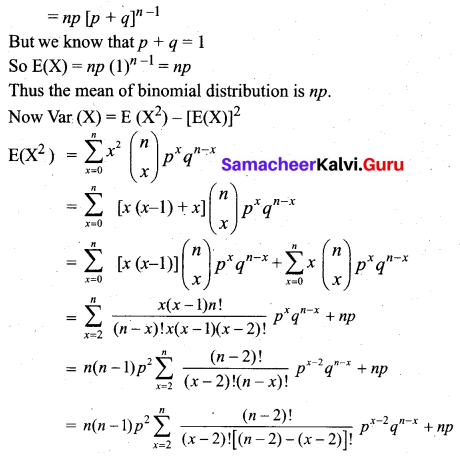
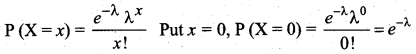
Question 6.
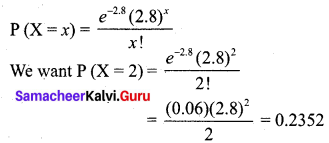
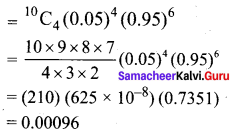
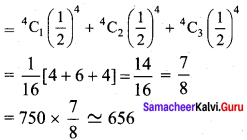
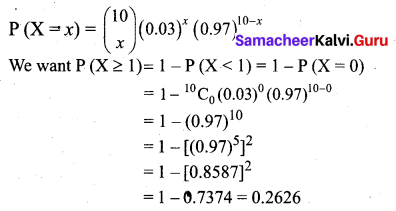
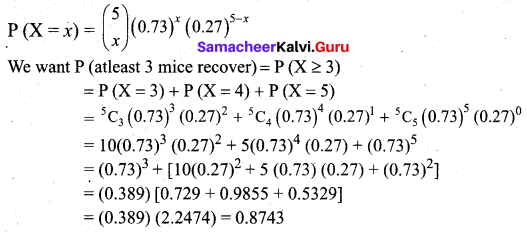
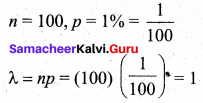
In turning out certain toys in a manufacturing company, the average number of defectives is 1%. The probability that the sample of 100 toys there will be 3 defectives is __________
(a) 0.0613
(b) 0.613
(c) 0.00613
(d) 0.3913
Answer:
(a) 0.0613
Hint:
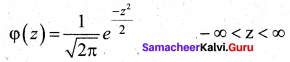
Question 7.
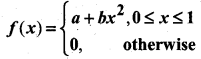
The parameters of the normal distribution f(x) = \(\frac{1}{\sqrt{72 \pi}} \frac{e^{(-x-10)^{2}}}{72}-\infty<x<\infty\)
(a) (10, 6)
(b) (10, 36)
(c) (6, 10)
(d) (36, 10)
Answer:
(b) (10, 36)
Hint:
Comparing f(x) with p.d.f of normal distribution, µ = 10,
\(\sigma \sqrt{2 \pi}=\sqrt{72 \pi}=\sqrt{36 \times 2 \pi}=6 \sqrt{2 \pi}\)
σ = 6
![]()
Question 8.
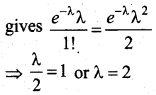
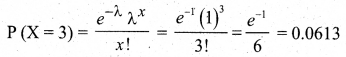
A manufacturer produces switches and experiences that 2 per cent switches are defective. The probability that in a box of 50 switches, there are at most two defective is:
(a) 2.5 e-1
(b) e-1
(c) 2e-1
(d) none of the above
Answer:
(a) 2.5 e-1
Hint:
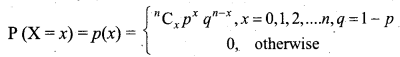
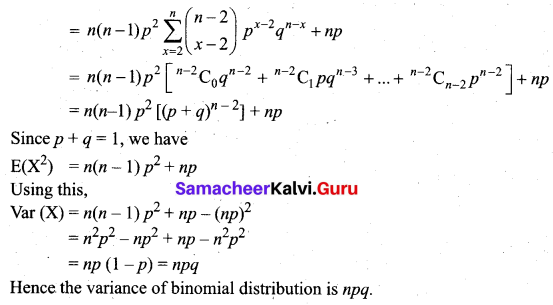
Question 9.
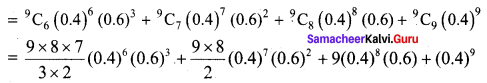
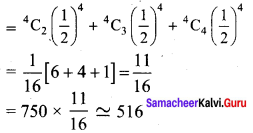
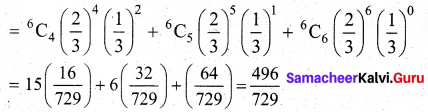
An experiment succeeds twice as often as it fails. The chance that in the next six trials, there shall be at least four successes is _______
(a) \(\frac {240}{729}\)
(b) \(\frac {489}{729}\)
(c) \(\frac {496}{729}\)
(d) \(\frac {251}{729}\)
Answer:
(c) \(\frac {496}{729}\)
Hint:
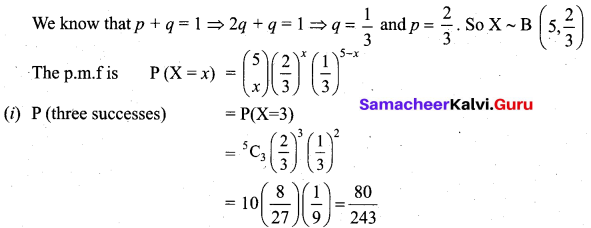
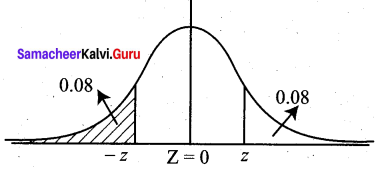
Let X be the binomial random variable. Given p = 2q
From p + q = 1 ,we get p = \(\frac{2}{3}\), q = \(\frac{1}{3}\)
We want P(X ≥ 4) = P(X = 4) + P(X = 5) + P(X = 6)
Question 10.
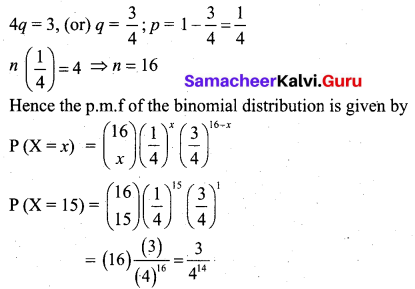
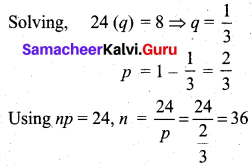
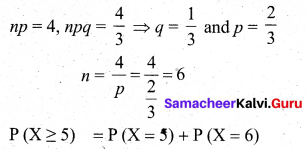
If for a binomial distribution b(n, p) mean = 4 and variance = \(\frac{4}{3}\), the probability, P(X ≥ 5) is equal to _______
(a) (2/3)6
(b) (2/3)5 (1/3)
(c) (1/3)6
(d) 4(2/3)6
Answer:
(d) 4(2/3)6
Hint:
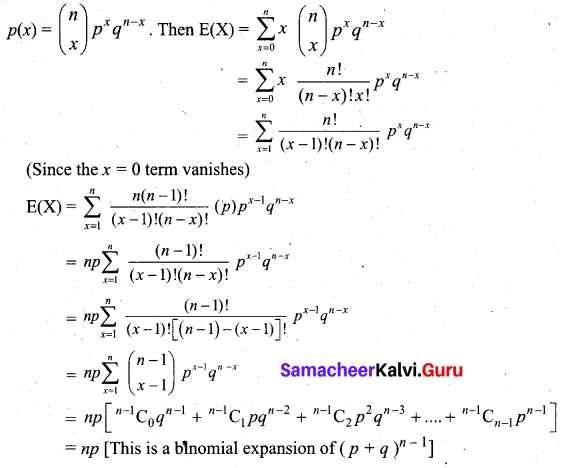
Question 11.
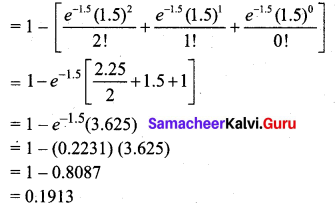
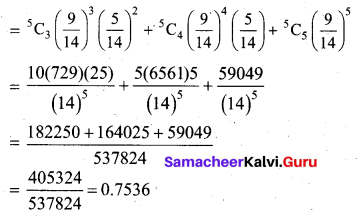
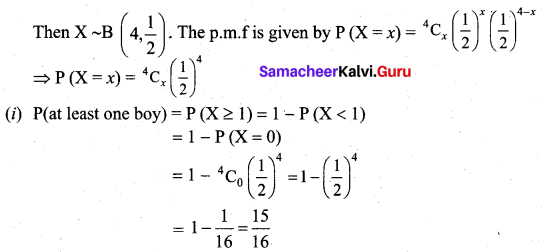
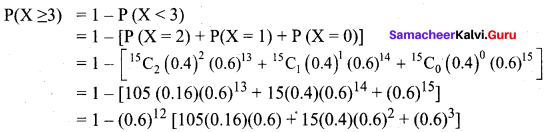
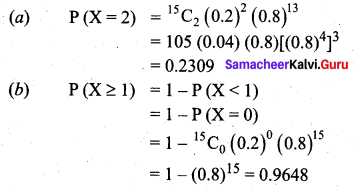
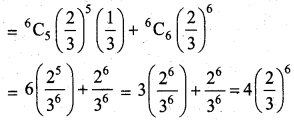
The average percentage of failure in a certain examination is 40. The probability that out of a group of 6 candidates atleast 4 passed in the examination are _______
(a) 0.5443
(b) 0.4543
(c) 0.5543
(d) 0.4573
Answer:
(a) 0.5443
Hint:
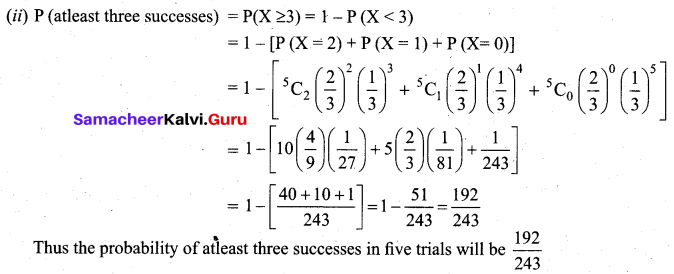
The percentage of success p = 0.6 ⇒ q = 0.4
P (X ≥ 4) = P (X = 4) + P (X = 5) + P (X = 6)
= 0.31104 + 0.186624 + 0.046656
= 0.54432
![]()
Question 12.
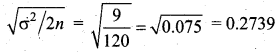
Forty per cent of the passengers who fly on a certain route do not check in any luggage. The planes on this route seat 15 passengers. For a full flight, what is the mean of the number of passengers who do not check in any luggage?
(a) 6.00
(b) 6.45
(c) 7.20
(d) 7.50
Answer:
(a) 6.00
Hint:
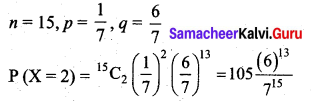
n = 15, p = 0.4 ⇒ mean (np) = 6
Question 13.
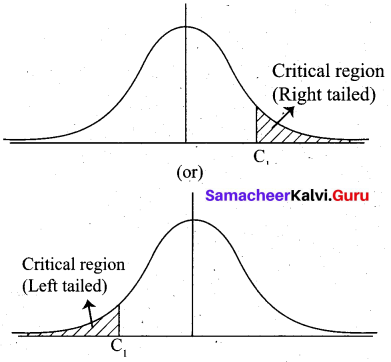
Which of the following statements is/are true regarding the normal distribution curve?
(а) it is a symmetrical and bell-shaped curve
(b) it is asymptotic in that each end approaches the horizontal axis but never reaches it
(c) its mean, median and mode are located at the same point
(d) all of the above statements are true
Answer:
(d) all of the above statements are true
![]()
Question 14.
Which of the following cannot generate a Poisson distribution?
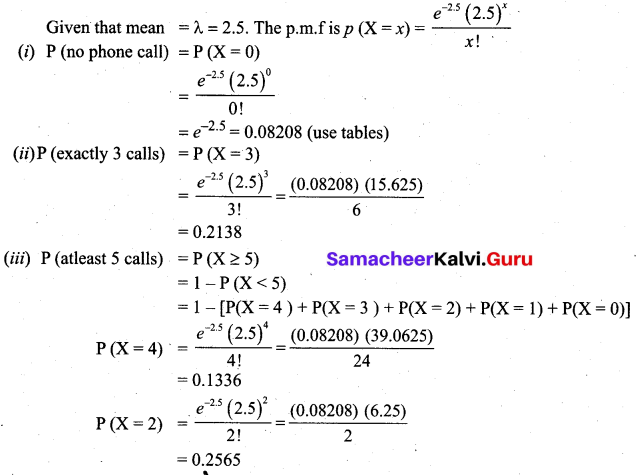
(а) The number of telephone calls received in a ten-minute interval
(b) The number of customers arriving at a petrol station
(c) The number of bacteria found in a cubic foot of soil
(d) The number of misprints per page
Answer:
(b) The number of customers arriving at a petrol station
Question 15.
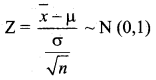
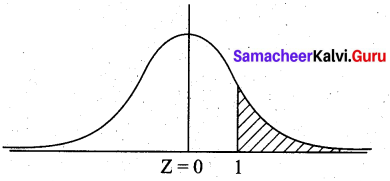
The random variable X is normally distributed with a mean of 70 and a standard deviation of 10. What is the probability that X is between 72 and 84?
(a) 0.683
(b) 0.954
(c) 0.271
(d) 0.340
Answer:
(d) 0.340
Hint:
µ = 70, σ = 10
P(72 < X < 84) = P(\(\frac{72-70}{10}\) < Z < \(\frac{84-70}{10}\))
= P(0.2 < Z < 1.4)
= P(0 < Z < 1.4) – P(0 < Z < 0.2)
= 0.4192 – 0.0793
= 0.3399
= 0.340
![]()
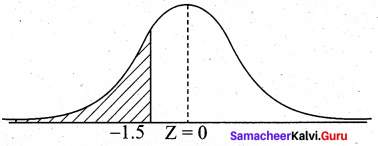
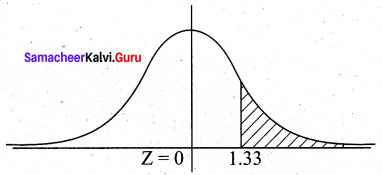
Question 16.
The starting annual salaries of newly qualified chartered accountants (CA’s) in South Africa follow a normal distribution with a mean of ₹ 180,000 and a standard deviation of ₹ 10,000. What is the probability that a randomly selected newly qualified CA will earn between ₹ 165,000 and ₹ 175,000.
(a) 0.819
(b) 0.242
(c) 0.286
(d) 0.533
Answer:
(b) 0.242
Hint:
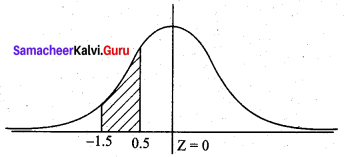
µ = 180,000, σ = 10,000
P(165,000 < X < 175,000)
= P(\(\frac{165,000-180,000}{10,000}\) < Z < \(\frac{175,000-180,000}{10,000}\))
= P(-1.5 < Z < -0.5)
By symmetry of the normal curve,
= P (0.5 < Z < 1.5)
= P (0 < Z < 1.5) – P(0 < Z < 0.5)
= 0.4332 – 0.1915
= 0.2417
= 0.242
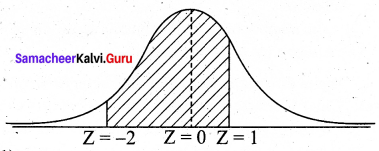
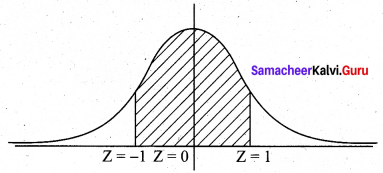
Question 17.
In a large statistics class the heights of the students are normally distributed with a mean of 172 cm and a variance of 25 cm. What proportion of students are between 165cm and 181 cm in height?
(a) 0.954
(b) 0.601
(c) 0.718
(d) 0.883
Answer:
(d) 0.883
Hint:
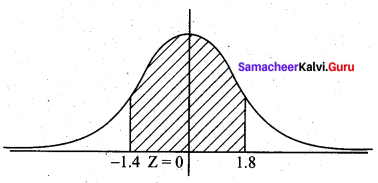
µ = 172, σ2 = 25 ⇒ σ = 5
P (165 < X < 181)
= P(\(\frac{165-172}{5}\) < Z < \(\frac{181-172}{5}\))
= P(-1.4 < Z < 1.8)
= P (-1.4 < Z < 0) + P(0 < Z < 1.8)
= P(0 < Z < 1.4) + P(0 < Z < 1.8)
= 0.4192 + 0.4641
= 0.8833
![]()
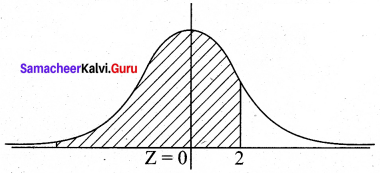
Question 18.
A statistical analysis of long-distance telephone calls indicates that the length of these calls is normally distributed with a mean of 240 seconds and a standard deviation of 40 seconds. What proportion of calls lasts less than 180 seconds?
(a) 0.214
(b) 0.094
(c) 0.933
(d) 0.067
Answer:
(d) 0.067
Hint:
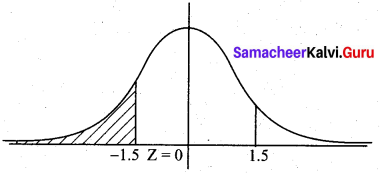
µ = 240, σ = 40
P(X < 180)
= P(Z < \(\frac{180-240}{40}\))
= P(Z < -1.5) = P(Z > 1.5)
= 0.5 – P (0 < Z < 1.5)
= 0.5 – 0.4332
= 0.0668
= 0.067
Question 19.
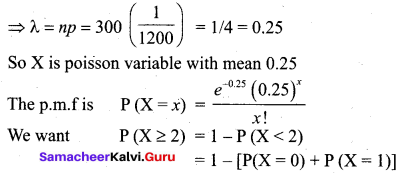
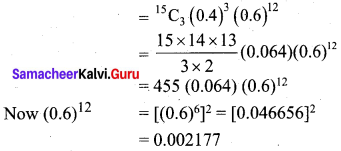
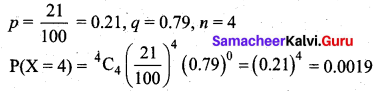
Cape town is estimated to have 21% of homes whose owners subscribe to the satellite service, DSTV. If a random sample of your home in taken, what is the probability that all four home subscribe to DSTV?
(a) 0.2100
(b) 0.5000
(c) 0.8791
(d) 0.0019
Answer:
(d) 0.0019
Hint:
Question 20.
Using the standard normal table, the sum of the probabilities to the right of z = 2.18 and to the left of z = -1.75 is:
(a) 0.4854
(b) 0.4599
(c) 0.0146
(d) 0.0547
Answer:
(d) 0.0547
Hint:
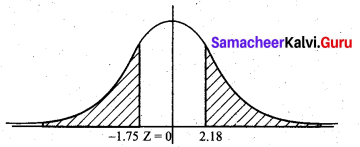
P(Z > 2.18) + P(Z < -1.75)
= 0.5 – P(0 < Z < 2.18) + P (Z > 1.75)
= 0.5 – P(0 < Z < 2.18) + 0.5 – P(0 < Z < 1.75)
= 0.5 – 0.4854 + 0.5 – 0.4599
= 0.0547
![]()
Question 21.
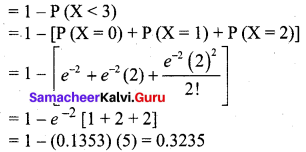
The time until first failure of a brand of inkjet printers is normally distributed with a mean of 1,500 hours and a standard deviation of 200 hours. What proportion of printers fails before 1000 hours?
(a) 0.0062
(b) 0.0668
(c) 0.8413
(d) 0.0228
Answer:
(a) 0.0062
Hint:
µ = 1500, σ = 200
P(X < 1000)
= P(Z < \(\frac{1000-1500}{200}\))
= P(Z < -2.5) = P (Z > 2.5)
= 0.5 – P (0 < Z < 2.5)
= 0.5 – 0.4938
= 0.0062
Question 22.
The weights of newborn human babies are normally distributed with a mean of 3.2 kg and a standard deviation of 1.1 kg. What is the probability that a randomly selected newborn baby weight less than 2.0 kg?
(a) 0.138
(b) 0.428
(c) 0.766
(d) 0.262
Answer:
(a) 0.138
Hint:
µ = 3.2, σ = 1.1
P (X < 2)
= P( Z < \(\frac{2-3.2}{1.1}\))
= P(Z < -1.09) = P(Z > 1.09)
= 0.5 – P(0 < Z < 1.09)
= 0.5 – 0.3621
= 0.138
![]()
Question 23.
Monthly expenditure on their credit cards, by credit card holders from a certain bank, follows a normal distribution with a mean of ₹ 1,295.00 and a standard deviation of ₹ 750.00. What proportion of credit card holders spend more than ₹ 1,500.00 on their credit cards per month?
(a) 0.487
(b) 0.394
(c) 0.500
(d) 0.791
Answer:
(b) 0.394
Hint:
µ = 1295, σ = 750
P(X > 1500)
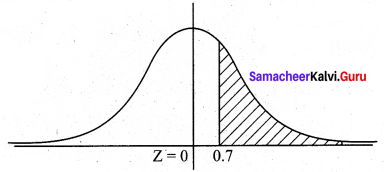
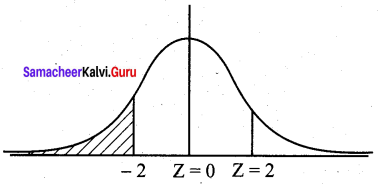
= P(Z > \(\frac{1500-1295}{750}\))
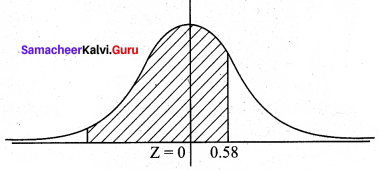
= P (Z > 0.27)
= 0.5 – P (0 < Z < 0.27)
= 0.5 – 0.1064
= 0.3936 ~ 0.394
Question 24.
Let z be a standard normal variable. If the area to the right of z is 0.8413, then the value of z must be:
(a) 1.00
(b) -1.00
(c) 0.00
(d) -0.41
Answer:
(b) -1.00
Hint:
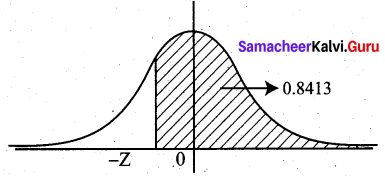
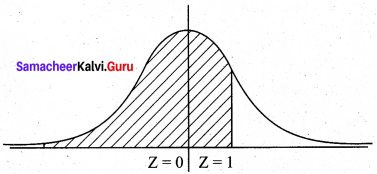
P(Z > -Z) = 0.8413
⇒ P(-z < Z < 0) + 0.5 = 0.8413
P(0 < Z < z) = 0.8413 – 0.5 = 0.3413
from normal tables, z = 1.
The required value is -z = -1
![]()
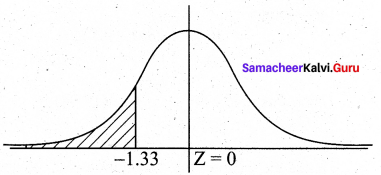
Question 25.
If the area to the left of a value of z (z has a standard normal distribution) is 0.0793, what is the value of z?
(a) -1.41
(b) 1.41.
(c) -2.25
(d) 2.25
Answer:
(a) -1.41
Hint:
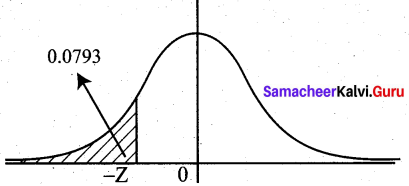
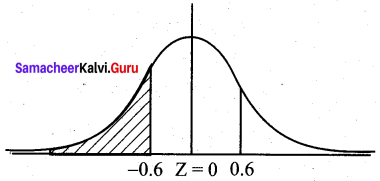
P(Z < -z) = 0.0793 By symmetry, P (Z > z) = 0.0793
(i.e) 0.5 – P (0 < Z < z) = 0.0793
P(0 < Z < z) = 0.4207 from normal tables, z = 1.41
Thus the required value is -1.41 (since it is left of Z = 0)
Question 26.
If P(Z > z) = 0.8508 what is the value of z (z has a standard normal distribution)?
(a) -0.48
(b) 0.48
(c) -1.04
(d) -0.21
Answer:
(c) -1.04
Hint:
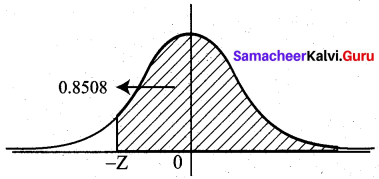
P (Z > z) = 0.8508
Since the given value is more than we take z to the left of Z = 0 axis.
P (Z > -z) = 0.8508
P(-z < Z < 0) + 0.5 = 0.8508
P(0 < Z < z) = 0.3508
From normal tables, z = 1.04
So required value is -1.04
![]()
Question 27.
If P(Z > z) = 0.5832 what is the value of z (z has a standard normal distribution)?
(a) -0.48
(b) 0.48
(c) 1.04
(d) -0.21
Answer:
(d) -0.21
Hint:
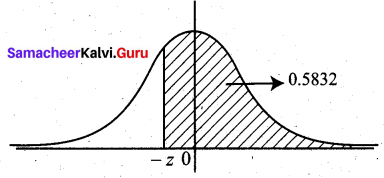
P(0 < Z < z) = 0.5832 – 0.5 = 0.0832
From tables, z = 0.21
Since z is to the left of Z = 0, the required value is -0.21
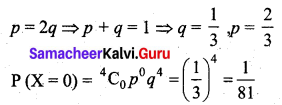
Question 28.
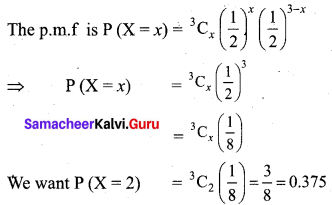
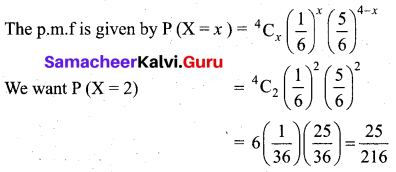
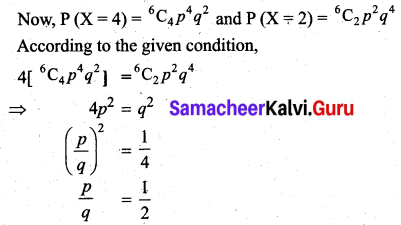
In a binomial distribution, the probability of success is twice as that of failure. Then out of 4 trials, the probability of no success is _______
(a) \(\frac {16}{81}\)
(b) \(\frac {1}{16}\)
(c) \(\frac {2}{27}\)
(d) \(\frac {1}{81}\)
Answer:
(d) \(\frac {1}{81}\)
Hint: