Students can download 12th Business Maths Chapter 8 Sampling Techniques and Statistical Inference Ex 8.2 Questions and Answers, Samacheer Kalvi 12th Business Maths Book Solutions Guide Pdf helps you to revise the complete Tamilnadu State Board New Syllabus and score more marks in your examinations.
Tamilnadu Samacheer Kalvi 12th Business Maths Solutions Chapter 8 Sampling Techniques and Statistical Inference Ex 8.2
Question 1.
Mention two branches of statistical inference?
Solution:
The two branches of statistical inference are estimation and testing of hypothesis.
Question 2.
What is an estimator?
Answer:
An estimator is a statistic that is used to infer the value of an unknown population parameter in a statistical model. The estimator is a function of the data arid so it is also a random variable.
![]()
Question 3.
What is an estimate?
Solution:
Any specific numerical value of the estimator is called an estimate. For example, sample means are used to estimate population means.
Question 4.
What is point estimation?
Solution:
Point estimation involves the use of sample data to calculate a single value which is to serve as a best estimate of an unknown population parameter. For example the mean height of 145 cm from a sample of 15 students is‘a point estimate for the mean height of the class of 100 students.
![]()
Question 5.
What is interval estimation?
Solution:
Interval estimation is the use of sample data to calculate an interval of possible values of an unknown population parameter. For example the interval estimate for the population mean is (101.01, 102.63).This gives a range within which the population mean is most likely to be located.
Question 6.
What is confidence interval?
Solution:
A confidence interval L a type of interval estimate, computed from the statistics of the observed data, that might contain the true value of an unknown population parameter. The numbers at the upper and lower end of a confidence interval are called confidence limits. For example, if mean is 7.4 with confidence interval (5.4, 9.4), then the numbers 5.4 and 9.4 are the confidence limits.
Question 7.
What is null hypothesis? Give an example.
Solution:
A null hypothesis is a type of hypothesis, that proposes that no statistical significance exists in a set of given observations. For example, let the average time to cook a specific dish is 15 minutes. The null hypothesis would be stated as “The population mean is equal to 15 minutes”, (i.e) H0 : µ = 15
![]()
Question 8.
Define the alternative hypothesis.
Solution:
The alternative hypothesis is the hypothesis that is contrary to the null hypothesis and it is denoted by H1.
For example if H1 : µ = 15, then the alternative hypothesis will be : H1 : µ ≠ 15, (or) H1 : µ < 15 (or) H1 : µ > 15.
Question 9.
Define the critical region.
Solution:
The critical region is the region of values that corresponds to the rejection of the null hypothesis at some chosen probability level. For the two-tailed test, the critical region is given below.
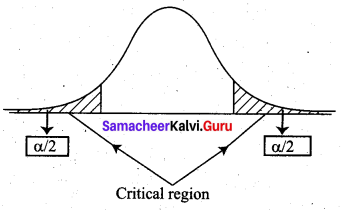
where α is the level of significance.
Question 10.
Define critical value.
Solution:
A critical value is a point on the test distribution that is compared to the test statistic to determine whether to reject the null hypothesis. It depends on the level of significance. For example, if the confidence level is 90% then the critical value is 1.645.
Question 11.
Define the level of significance
Solution:
The level of significance is defined as the probability of rejecting a null hypothesis by the test when it is really true, which is denoted as α. That is P(Type 1 error) = α. For example, the level of significance 0.1 is related to the 90% confidence level.
![]()
Question 12.
What is a type I error?
Solution:
In statistical hypothesis testing, a Type f error is the rejection of a true null hypothesis. Example of Type I errors includes a test that shows a patient to have a disease when he does not have the disease, a fire alarm going on indicating a fire when there is no fire (or) an experiment indicating that medical treatment should cure a disease when in fact it does not.
Question 13.
What is the single-tailed test?
Solution:
A single-tailed test or a one-tailed test is a statistical test in which the critical area of a distribution is one-sided so that it is either greater than or less than a certain value, but not both. For the null hypothesis H0 : µ = 16.91, the alternative hypothesis H1 : µ > 16.91 or H1 : µ < 16.91 are one-tailed tests.
Question 14.
A sample of 100 items, draw from a universe with mean value 4 and S.D 3, has a mean value 3.5. Is the difference in the mean significant?
Solution:
Given Sample size n = 100
Sample mean \(\bar{x}\) = 3.5
Population mean µ = 4
Population SD σ = 3
Now, null hypothesis H0 : µ = 4
Alternative hypothesis H1 : µ ≠ 4 (Two tail)
We take level of significance α = 5% = 0.05
The table value \(\mathrm{Z}_{\alpha / 2}\) = 1.96
Test statistic
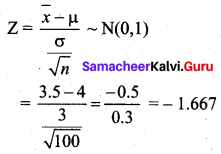
Since the alternative hypothesis is of the two-tailed test we can take |Z| = 1.667. We observe that 1.667 < 1.96 (i.e) |Z| < \(\mathrm{Z}_{\alpha / 2}\). So at 5% level of significance, the null hypothesis H0 is accepted. Therefore, we conclude that there is no significant difference between the sample mean and the population mean.
![]()
Question 15.
A sample of 400 individuals is found to have a mean height of 67.47 inches. Can it be reasonably regarded as a sample from a large population with a mean height of 67.39 inches and standard deviation of 1.30 inches?
Solution:
Given Sample size n = 400
Sample mean \(\bar{x}\) = 67.47
Population mean µ = 67.39
Population SD σ = 1.3
Null hypothesis H0 : µ = 67.39 inches
(the sample has been drawn from the population with mean heights 67.39 inches)
Alternative hypothesis H1 : µ ≠ 67.39 inches
(the sample has not been drawn from the population with mean height 67.39 inches)
The level of significance α = 5% = 0.05
Test statistic
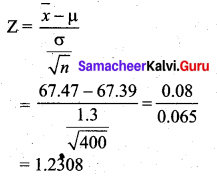
The significant value or table value \(\mathrm{Z}_{\alpha / 2}\) = 1.96. We see that 1.2308 < 1.96 (i.e) Z < \(\mathrm{Z}_{\alpha / 2}\). Since the calculated value is less than the table value at 5% level of significance, the null hypothesis is accepted. Hence we conclude that the data does not provide us with any evidence against the null hypothesis. Thus, the sample has been drawn from a large population with a mean height of 67.39 inches and S.D 1.3 inches.
Question 16.
The average score on a nationally administered aptitude test was 76 and the corresponding standard deviation was 8. In order to evaluate a state’s education system, the scores of 100 of the state’s students were randomly selected. These students had an average score of 72. Test at a significance level of 0.05 if there is a significant difference between the state scores and the national scores.
Solution:
Given Population mean µ = 76
Population SD σ = 8
Sample size n = 100
Sample mean \(\bar{x}\) = 72
Significance level α = 0.05
Null hypothesis H0 : µ = 76
(i.e) there is no difference between the state scores and the national scores.
Alternative hypothesis H1 : µ ≠ 76
(i.e) there is a significant difference between the state scores and the nationals scores of the aptitude test.
Test statistic
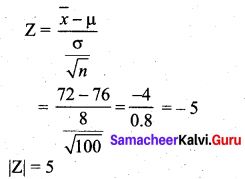
The significant value or table value \(\mathrm{Z}_{\alpha / 2}\) = 1.96. Comparing the calculated value and table value, we find that |Z| > \(\mathrm{Z}_{\alpha / 2}\) (i.e) 5 > 1.96. So the null hypothesis is rejected and we accept the alternative hypothesis. So we conclude that at the significance level of 5%, there is a difference between the state scores and the national scores of the nationally administered amplitude test.
![]()
Question 17.
The mean breaking strength of cables supplied by a manufacturer is 1,800 with a standard deviation of 100. By a new technique in the manufacturing process it is claimed that the breaking strength of the cables has increased. In order to test this claim a sample of 50 cables is tested. It is found that the mean breaking strength is 1,850. Can you support the claim at 0.01 level of significance?
Solution:
Given Population mean µ = 1800
Population SD σ = 100
Sample size n = 50
Sample mean \(\bar{x}\) = 1850
Significance level α = 0.01
Null hypothesis H0 : µ = 1800
(i.e) the breaking strength of the cables has not increased, after the new technique in the manufacturing process.
Alternative hypothesis H1 : µ > 1800 (i.e) the new technique was successful.
Test statistic
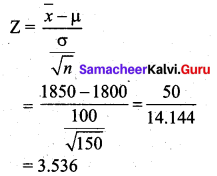
The table value for the one-tailed test is Zα = 2.33.
Comparing the calculated value and table value, we find that Z > Zα (i.e.) 3.536 > 2.33.
Inference: Since the calculated value is greater than the table value at 1 % level of significance, the null hypothesis is rejected and we accept the alternative hypothesis. We conclude that by the new technique in the manufacturing process the breaking strength of the cables is increased. So the claim is supported at 0.01 level of significance.