Students can Download Maths Chapter 4 Statistics Ex 4.3 Questions and Answers, Notes Pdf, Samacheer Kalvi 8th Maths Book Solutions Guide Pdf helps you to revise the complete Tamilnadu State Board New Syllabus and score more marks in your examinations.
Tamilnadu Samacheer Kalvi 8th Maths Solutions Term 3 Chapter 4 Statistics Ex 4.3
Miscellaneous and Practice Problems
Question 1.
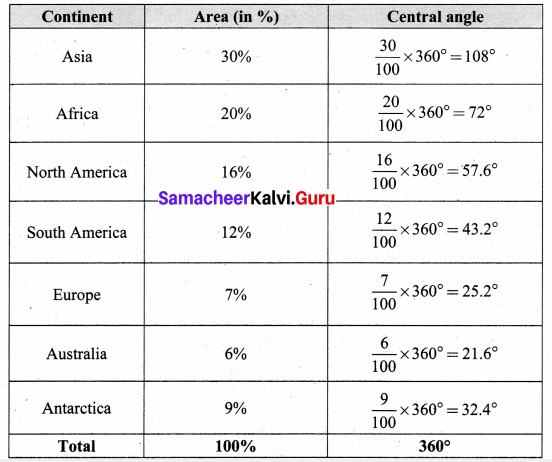
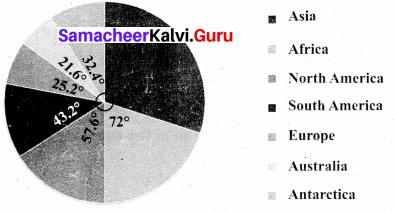
Draw a pie chart for the given table.

Solution:
Converting the area in percentage into components parts of 360°, we have.
![]()
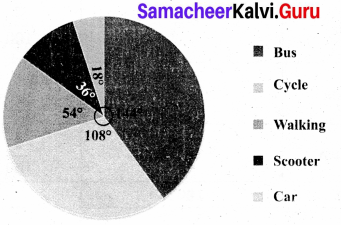
Question 2.
The data on modes of transport used by the students to come to school are given below. Draw a pie chart for the data.

Solution:
Converting the percentage into components parts of 360°, we have
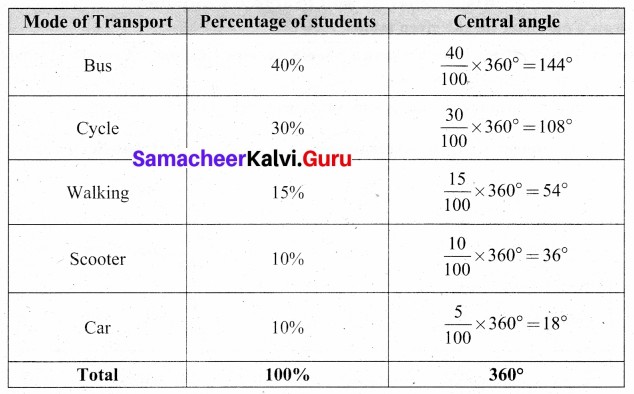
Mode of Transport by students.
![]()
Question 3.
Draw a histogram for the given frequency distribution.
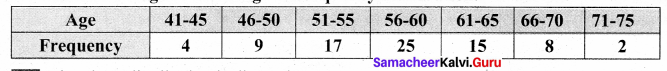
Solution:
The given distribution is discontinuous.
Lower boundary = lower limit — \(\frac { 1 }{ 2 } \) (gap between the adjacent class interval)
= 41 – \(\frac { 1 }{ 2 } \) (1) = 40.5
Upper boundary = Upper limit + \(\frac { 1 }{ 2 } \) (gap between the adjacent class interval)
= 45 + \(\frac { 1 }{ 2 } \) (1) = 45.5
Now continuous frequency table is as below
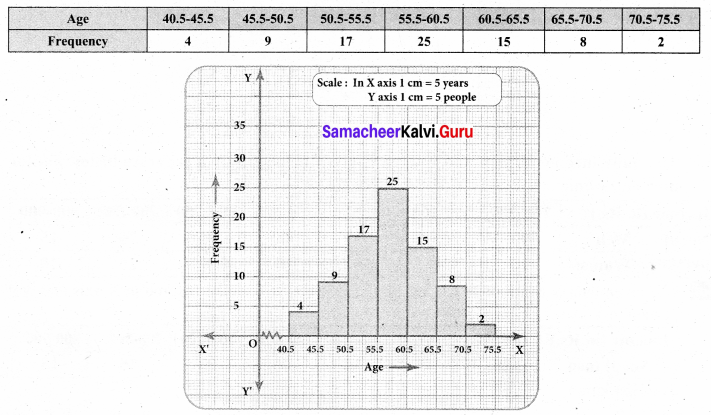
Question 4.
Draw a histogram and the frequency polygon in the same diagram to represent the following data.

Solution:
The given distribution is discontinuous.
Lower boundary = lower limit – \(\frac { 1 }{ 2 } \) (gap between the adjacent class interval)
= 50 – \(\frac { 1 }{ 2 } \) (1) = 49.5
Upper boundary = Upper limit + \(\frac { 1 }{ 2 } \) (gap between the adjacent class interval)
= 55 + \(\frac { 1 }{ 2 } \) (1) = 55.5
∴ The continuous frequency table is as below.
![]()
Question 5.
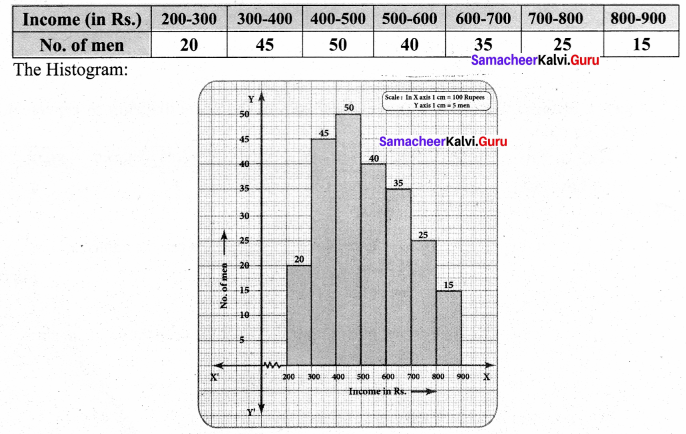
The daily income of men and women is given below, draw a separate histogram for men and women.
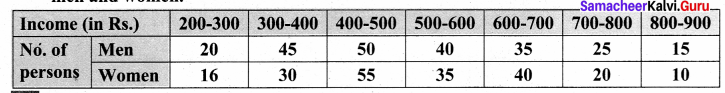
Solution:
The given data is continuous frequency distribution. So we take Income in X axis and No. of men in Y axis.
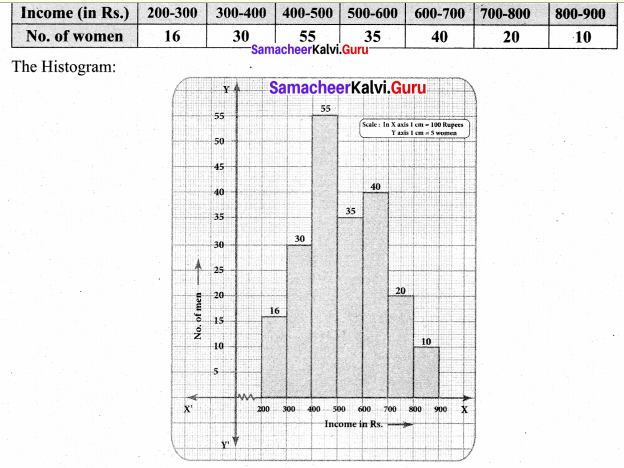
Now we consider the number of women and their income we have.
![]()
Challenging Problems
Question 1.
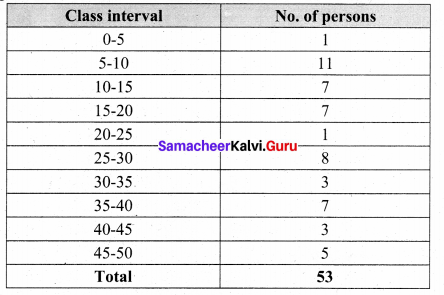
Form a continuous frequency distribution table and draw histogram from the following data.
Solution:
Converting into continuous distribution we have
Question 2.
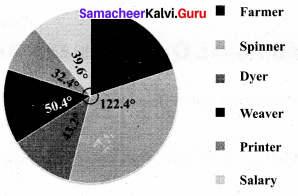
A rupee spent in a cloth manufacturing company is distributed as follows. Represent this in a pie chart.
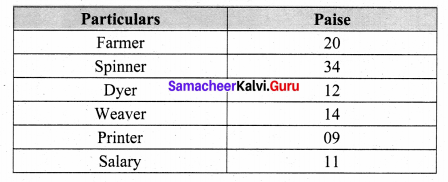
Solution:
1 Rupee = 100 paise.
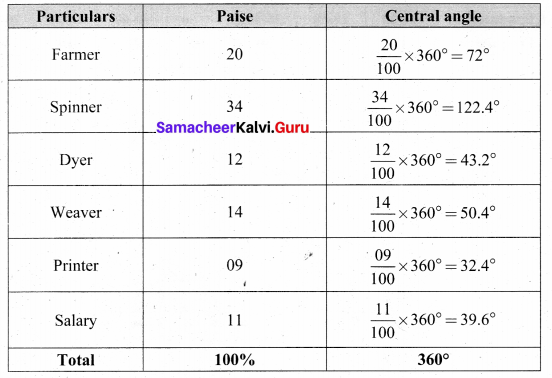
![]()
Expenditure of a cloth manufacturing company.
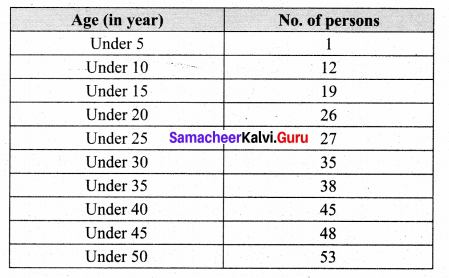
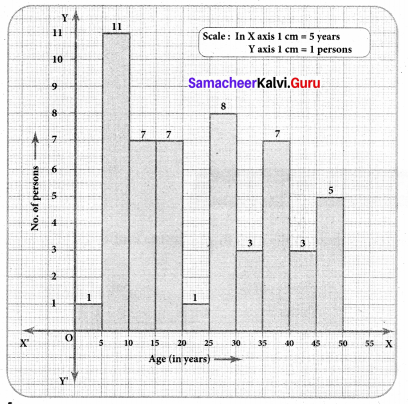
Question 3.
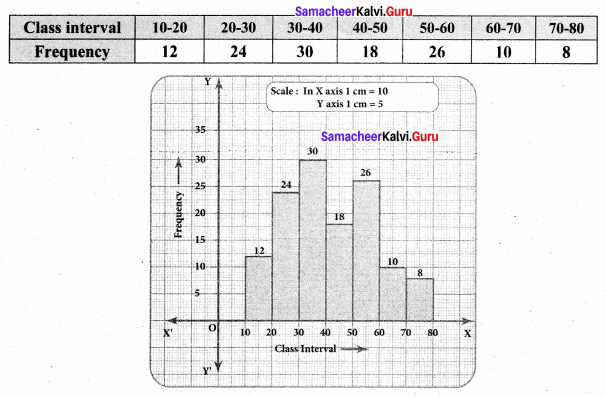
Draw a histogram for the following data.
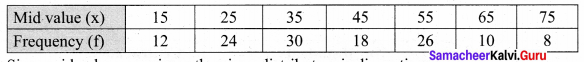
Solution:
Since mid values are given, the given distributors is discontinuous.
Lower boundary = lower limit — \(\frac { 1 }{ 2 } \) (gap between the adjacent class interval)
= 15 – \(\frac { 1 }{ 2 } \) (10) = 10
Upper boundary = Upper limit + \(\frac { 1 }{ 2 } \) (gap between the adjacent class interval)
15 + \(\frac { 1 }{ 2 } \) (10) = 20
The continuous distribution will be as follows.