Students can Download Maths Chapter 4 Statistics Ex 4.1 Questions and Answers, Notes Pdf, Samacheer Kalvi 8th Maths Book Solutions Guide Pdf helps you to revise the complete Tamilnadu State Board New Syllabus and score more marks in your examinations.
Tamilnadu Samacheer Kalvi 8th Maths Solutions Term 3 Chapter 4 Statistics Ex 4.1
Question 1.
Fill in the blanks
- Data has already been collected by some other person is _______ data.
- The upper limit of the class interval (25-35) is _______
- The range of the data 200, 15, 20, 103, 3, 197, is _______
- If a class size is 10 and range is 80 then the number of classes are _______
- Pie chart is a _______ graph.
Answers:
- Secondary
- 35
- 197
- 8
- circular
![]()
Question 2.
Say True or False
- Inclusive series is a continuous series.
- Pie charts are easy to understand.
- Same pie chart can be used for different samples.
- Media and business people use pie charts.
- A pie diagram is a circle broken down into component sectors.
Answers:
- False
- True
- False
- True
- True
Question 3.
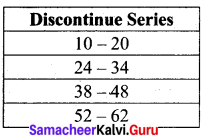
The continuous series of
Solution:
Difference in the gap = 24 – 20 = 4
Here half of the gap = \(\frac { 1 }{ 2 } \) (4) = 2
∴ 2 is the adjustment factor. So we subtract 2 from the lower limit and add 2 to the upper limit to make it as a continuous series.
| Discontinue Series | Continuous Series |
| 10-20 | 8-22 |
| 24-34 | 22-36 |
| 38-48 | 36-50 |
| 52-62 | 50-64 |
![]()
Question 4.
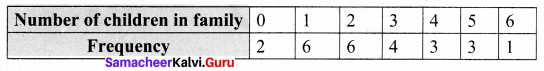
Represent the following data in ungrouped frequency table which gives the number of children in 25 families.
1, 3, 0, 2, 5, 2, 3, 4, 1, 0, 5, 4, 3, 1, 3, 2, 5, 2, 1, 1, 2, 6, 2, 1, 4
Solution:
The data given is raw data. Ascending order : 0, 1, 2, 3, 4, 5, 6
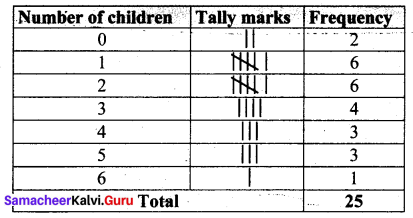
∴ Tabulating in frequency distribution table we get
Question 5.
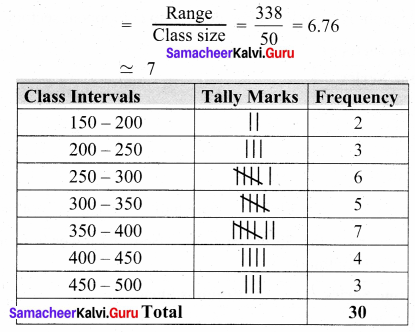
Form a continuous frequency distribution table for the marks obtained by 30 students in a X std public examination.
328, 470, 405, 375, 298, 326, 276, 362, 410, 255, 391, 370, 455, 229, 300, 183, 283, 366, 400, 495, 215, 157, 374, 306, 280, 409, 321, 269, 398, 200.
Solution:
Maximum mark obtained = 495
Minimum marks obtained = 157
Range = Maximum value – Minimum value
Range = 495 – 157 = 338
If we take the class size as 50 then the number of class intervals possible
Question 6.
Apaint company asked a group of students about their favourite colours and made a pie chart of their iindings. Use the information to answer the following questions.
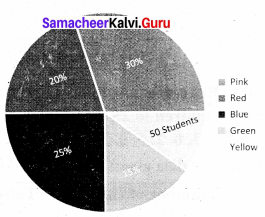
(i) What percentage of the students like red colour?
(ii) How many students liked green colour?
(iii) What fraction of the students liked blue?
(iv) How many students did not like red colour?
(v) How many students liked pink or blue?
(vi) How many students were asked about their favourite colours?
Solution:
Total percentage of students = 100%
∴ 50 students = 100 % – (30% + 20% + 25% + 15%)
= 100 % – 90%
50 students = 10%
of total students = 50
∴ \(\frac { 10 }{ 100 } \) (Total students) = 50
Total students = \(\frac{50 \times 100}{10}\) = 500.
Total students = 500
(i) 20% of the students like red colour.
(ii) 15% of the students liked green colour.
\(\frac { 15 }{ 100 } \) × 500 = 75 students liked green colour.
(iii) 25% students liked blue ⇒ \(\frac { 25 }{ 100 } \) students liked blue.
⇒ \(\frac { 1 }{ 4 } \) students liked blue.
(iv) Percentage of students liked red colour = 20 %
Percentage of students did not like red colour
= 100% – 20% = 80%
∴ Number of students did not like red colour
= 80% of 500 = \(\frac { 80 }{ 100 } \) × 500 = 400
400 students did not like red colour.
(v) Students liked pink or blue = students liked pink + students liked blue.
= 30% of 500 + 25% of 500
= \(\frac { 30 }{ 100 } \) × 500 + × 500 = 150 + 125 = 275
(vi) Total number of students = 500.
500 students were asked about their favourite colour.
![]()
Question 7.
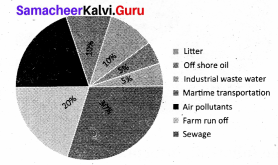
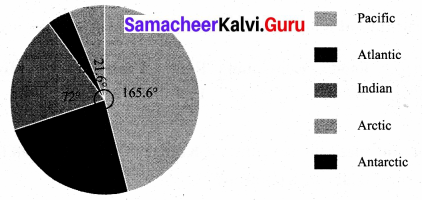
Write any five points from the given pie chart information regarding pollutants entering in the oceans.
Solution:
- The pie chart gives the information about the amount of pollutants entering in oceans from various sources.
- 30% of ocean is polluted by sewage.
- 20% of ocean is polluted by air.
- Farm run off equally contribute as much as air in polluting ocean.
- The observation is about off shore oil, litter, Industrial waste water, Maritime transportation, Air pollution, Farm run off and sewage.
Question 8.
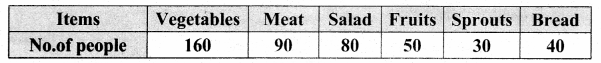
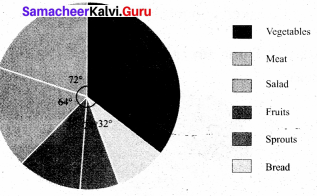
A survey gives the following information of food items preferred by people. Draw a Pie chart.
Solution:
Total number of people = 160 + 90 + 80 + 50 + 30 + 40 = 450
Converting the number of people prefer various food items into components part of 360°

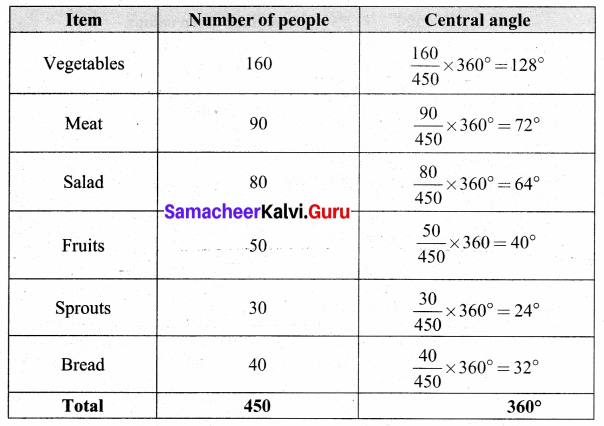
Food items preferred by people.
![]()
Question 9.
Draw a pie chart for the following information.
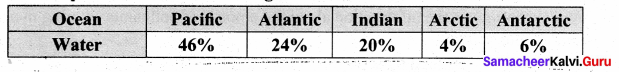
Solution:
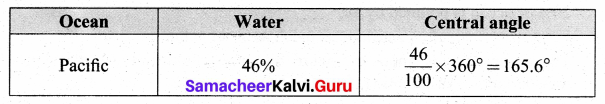
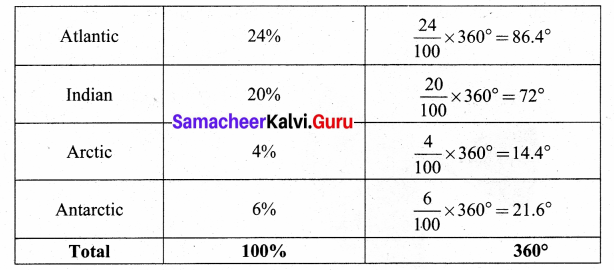
Water in Ocean
Question 10.
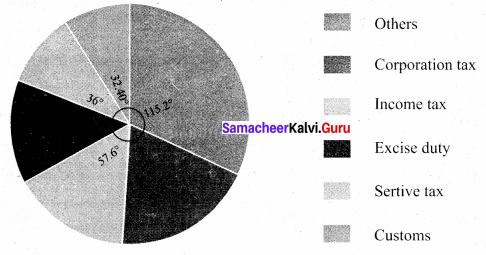
Income from various sources for Government of India from a rupee is given below. Draw a pie chart.
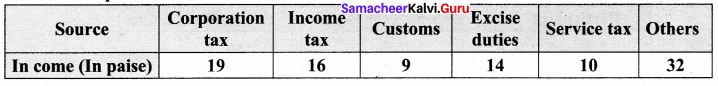
Solution:
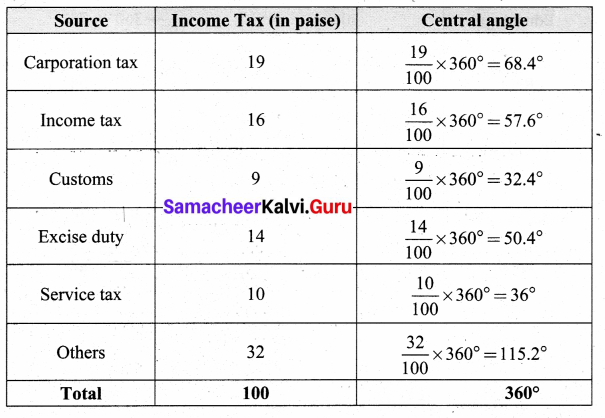
Income from various sources for Government of India in a rupee.
![]()
Question 11.
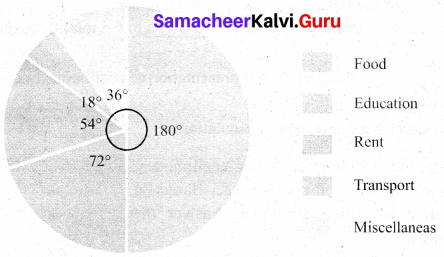
Monthly expenditure of Kumaran’s family is given below. Draw a suitable Pie chart.

Also
1. Find the amount spent for education if Kumaran spends ₹ 6000 for Rent.
2. What is the total salary of Kumaran?
3. How much did he spend more for food than education?
Solution:
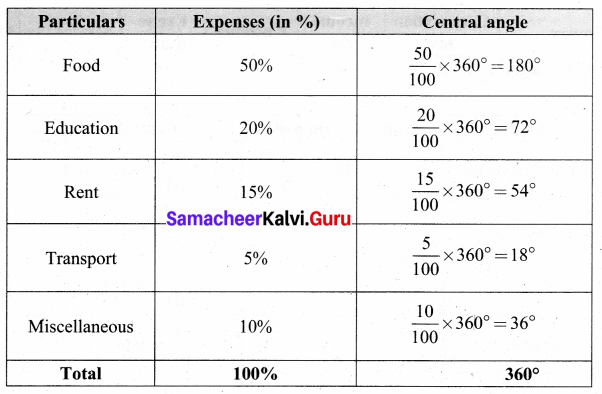
Monthly expenditure of Kumaran’s family
1. Given Kumaran spends ₹ 6000 for Rent.
∴ 15% oftotal expenditure
\(\frac { 15 }{ 100 } \) (Total Expenditure) = 6000
Total Expenditure = \(\frac{6000 \times 100}{15}\)
Total Expenditure = ₹ 40,000
Amount spend for education = 20% of total expenditure.
\(\frac { 20 }{ 100 } \) × 40,000 = ₹ 8000
2. Total salary of Kumaran = ₹ 40,000
3. Amount spend for food = 50% of (40,000)
Amount spend for the food than education = 20,000 – 8,000 = ₹ 12,000