Students can download 12th Business Maths Chapter 9 Applied Statistics Ex 9.3 Questions and Answers, Samacheer Kalvi 12th Business Maths Book Solutions Guide Pdf helps you to revise the complete Tamilnadu State Board New Syllabus and score more marks in your examinations.
Tamilnadu Samacheer Kalvi 12th Business Maths Solutions Chapter 9 Applied Statistics Ex 9.3
Question 1.
Define Statistical Quality Control.
Solution:
Statistical quality control (SQC) refers to the use of statistical methods in the monitoring and maintaining of the quality of products and services. This method is used to determine the tolerance limits for accepting a production process.
Question 2.
Mention the types of causes for variation in a production process.
Solution:
There are two causes of variations between items produced under identical conditions in large production process. They are called assignable causes and non-assignable causes (chance causes).
![]()
Question 3.
Define Chance Cause.
Solution:
The minor causes which do not affect the quality of the products to an extent are called as chance causes or Random causes. For example rain, floods, power cuts, etc.
Question 4.
Define Assignable Cause.
Solution:
The variations in input factors which are the causes for the variations in the output produc¬tions are called assignable causes. For example defective raw materials, fault in instruments used, fatigue of workers employed, unskilled technicians, worn out tools etc.
![]()
Question 5.
What do you mean by product control?
Solution:
Product control means controlling the quality of the product by a sampling technique called acceptance sampling. It aims at a certain quality level to he guaranteed to the customers. It is concerned with classification of raw materials, semi-finished goods or finished goods into acceptable or rejectable products.
Question 6.
What do you mean by process control?
Solution:
A production process is said to be under control if the products produced are according to the specifications; that is the characteristics are within the tolerance limits. This is tested through the control charts.
![]()
Question 7.
Define a control chart.
Solution:
Control charts are statistical tools to test whether a production process is under control. It was introduced by Watter.A.Shewhart. It is a simple technique used for detecting patterns of variations in the data. It consists of three lines namely, centre line (CL), Upper control limit (UCL) and Lower control limit (LCL)
Question 8.
Name the control charts for variables.
Solution:
A quality characteristic which can be expressed in terms of a numerical value in the production process is called as a variable. There are two types of control charts for variables.
- Mean chart (\(\bar{X}\) chart)
- Range chart (R chart).
![]()
Question 9.
Define the mean chart.
Solution:
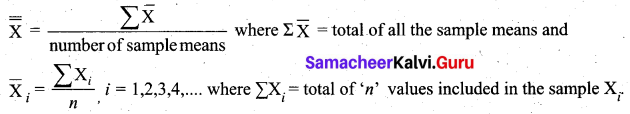
The mean chart (\(\bar{X}\) chart) is used to show the quality averages of the samples taken from the given process. The mean of the samples is first calculated. Then the mean of the sample means is found to get the control limits.
Question 10.
Define R Chart.
Solution:
The R chart is used to show the variability or dispersion of the samples taken from the given process. The average range is given by \(\overline{\mathrm{R}}=\frac{\sum R}{n}\), where R = xmax – xmin for each ‘n’ samples. For samples of size less than 20, the range provides a good estimate of σ. Hence to measure the variance in the variable, range chart is used.
![]()
Question 11.
What are the uses of statistical quality control?
Solution:
The term Quality means a level or standard of a product which depends on Material, Manpower, Machines, and Management (4M’s). Quality Control ensures the quality specifications all along with them from the arrival of raw materials through each of their processing to the final delivery of goods. This technique is used in almost all’ production industries such as automobile, textile, electrical equipment, biscuits, bath soaps, chemicals, petroleum products etc.
Question 12.
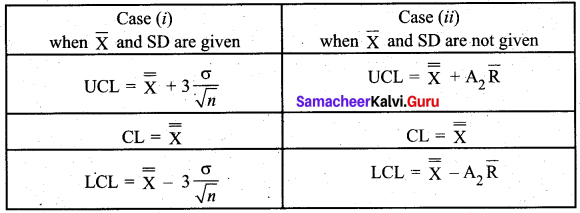
Write the control limits for the mean chart.
Solution:
The calculation of control limits for \(\bar{X}\) chart in two different cases are
![]()
Question 13.
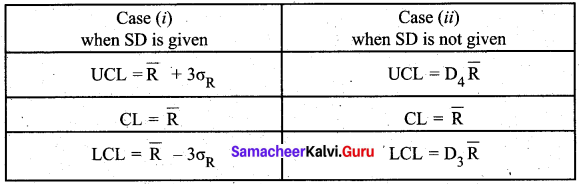
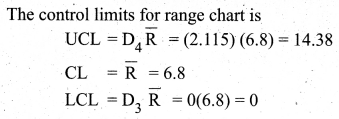
Write the control limits for the R chart.
Solution:
The calculation of control limits for R chart in two different cases are
Question 14.
A machine is set to deliver packets of a given weight. Ten samples of size five each were recorded. Below are given relevant data:
Calculate the control limits for the mean chart and the range chart and then comment on the state of control.
(conversion factors for n = 5, A2 = 0.58, D3 = 0 and D4 = 2.115)
Solution:
The above diagram shows all the three control lines with the data points plotted. We see that all the points of the sample mean are within the control limits.
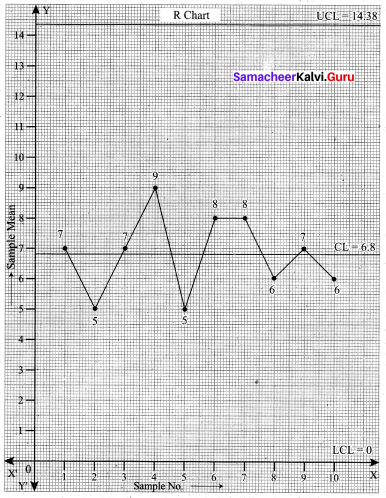
We now draw the R chart for the given data.
The above diagram shows all the three control lines with the sample range points plotted. We observe that all the points are within the control limits.
Conclusion: From the above two plots of the sample mean \(\bar{X}\) and sample range R, we conclude that the process is in control.
![]()
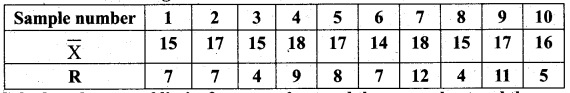
Question 15.
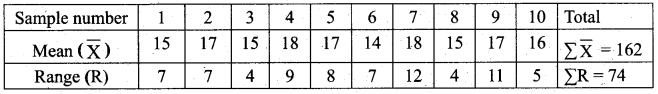
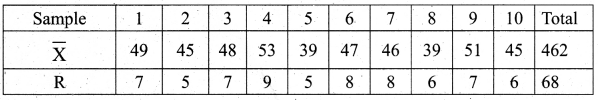
Ten samples each of size five are drawn at regular intervals from a manufacturing process. The sample means (\(\bar{X}\)) and their ranges (R) are given below:
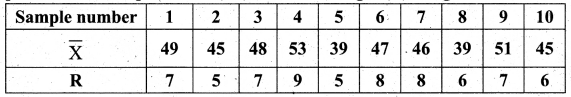
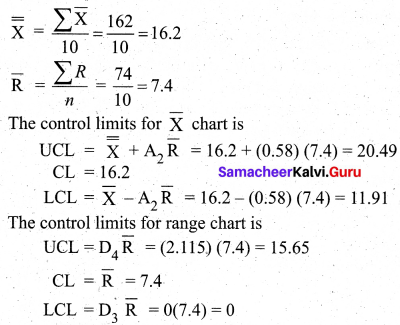
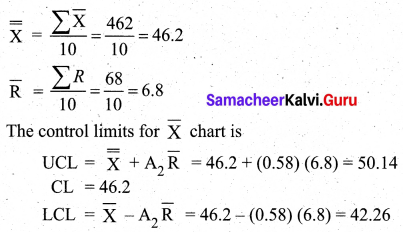
Calculate the control limits in respect of \(\bar{X}\) chart.
(Given A2 = 0.58, D3 = 0 and D4 = 2.115) Comment on the state of control
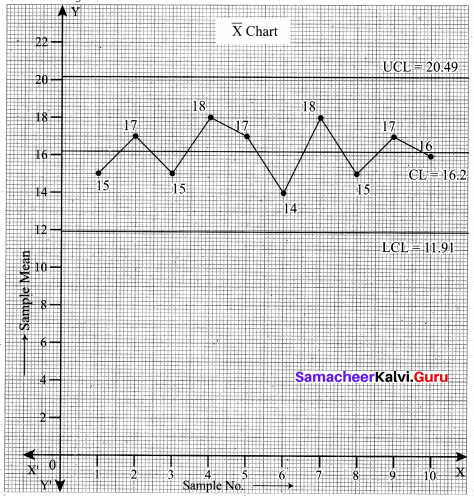
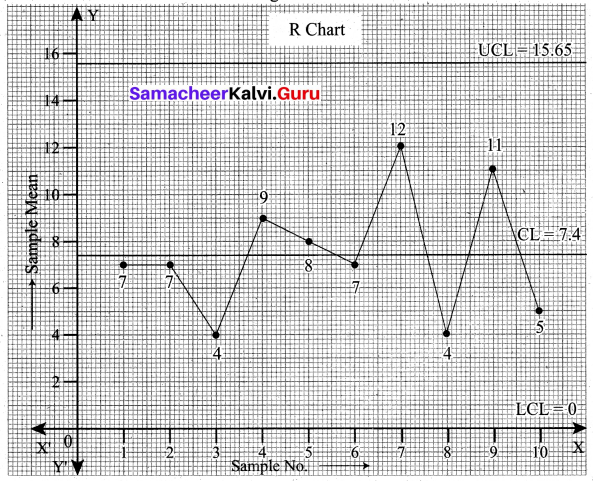
Solution:
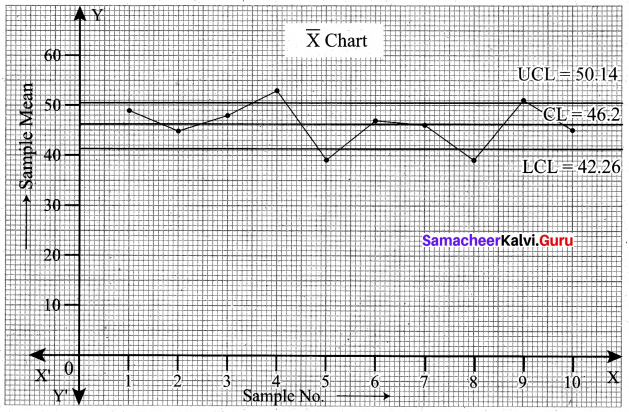
From the \(\bar{X}\) chart, we see that 4 points are outside the control limit lines. So we say that the process is out of control.
Question 16.
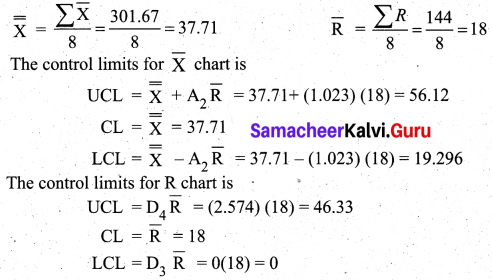
Construct \(\bar{X}\) and R charts for the following data:
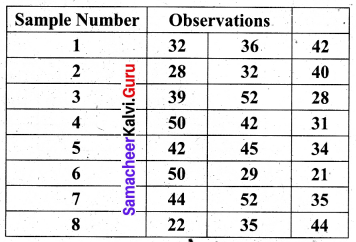
(Given for n = 3, A2 = 1.023, D3 = 0 and D4 = 2.574)
Solution:
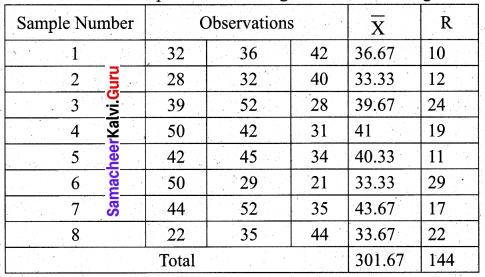
We first find the sample mean and range for each of the 8 given samples.
![]()
Question 17.
The following data show the values of the sample mean (\(\bar{X}\)) and its range (R) for the samples of Size five each. Calculate the values for control limits for mean, range chart and determine whether the process is in control.
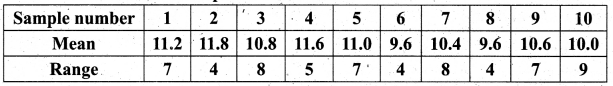
(conversion factors for n = 5, A2 = 0.58, D3 = 0 and D4 = 2.115)
Solution:
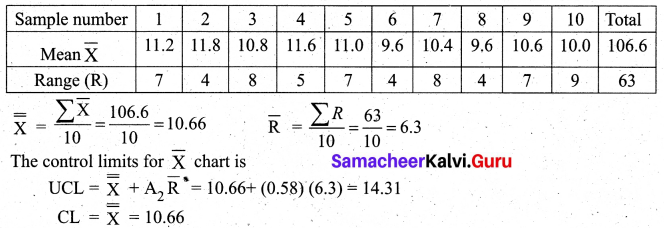
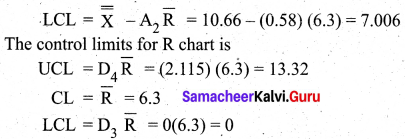
From the above control limits values we observe that all the sample means lie between the UCL and LCL (i.e.) 7.006 < \(\overline{\mathrm{x}}_{i}\) < 14.31 for i = 1, 2, 3,…….. 10. Also all the sample range value lie between the control limits for R (i.e) 0 < Ri < 13.32, i = 1, 2, 3,…., 10. Hence we conclude that the process is in control.
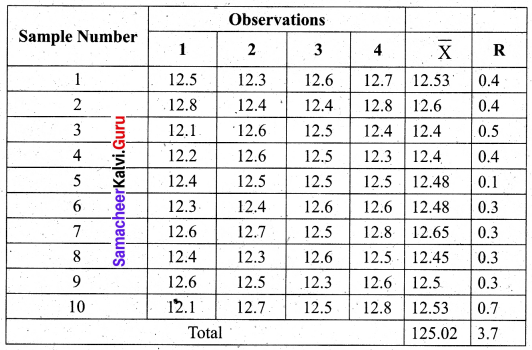
Question 18.
A quality control inspector has taken ten samples of size four packets each from a potato chips company. The contents of the sample are given below, Calculate the control limits for the mean and range chart.
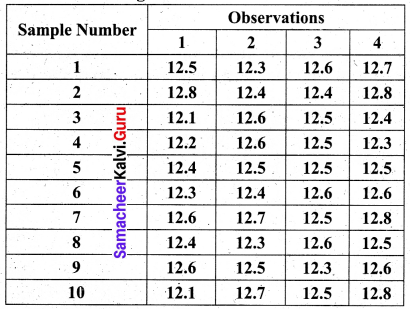
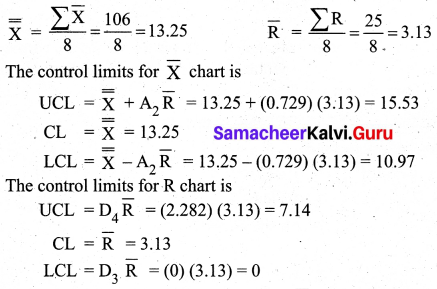
(Given for n = 4, A2 = 0.729, D3 = 0 and D4 = 2.282)
Solution:
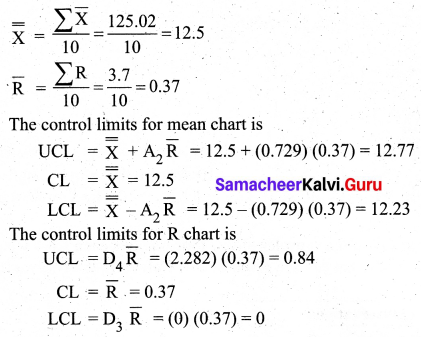
![]()
Question 19.
The following data show the values of sample means and the ranges for ten samples of size 4 each. Construct the control chart for mean and range chart and determine whether the process is in control
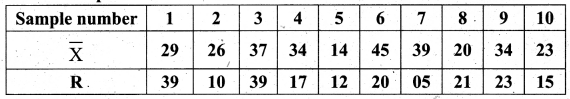
Solution:
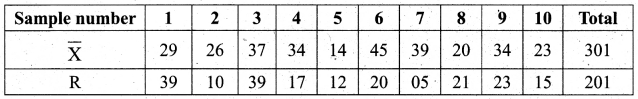
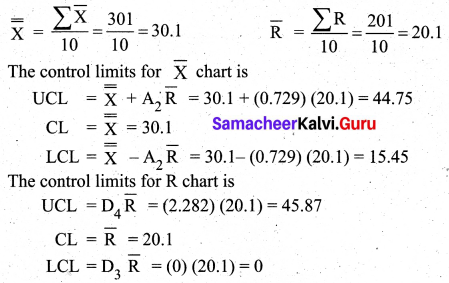
From the values of the control limits for \(\bar{X}\), we observe that one sample \(\bar{X}\) value (45) is above the UCL and one sample \(\bar{X}\) value (14) is below the LCL. Hence we conclude that the process is out of control.
Question 20.
In a production process, eight samples of size 4 are collected and their means and ranges are given below. Construct a mean chart and range chart with control limits.
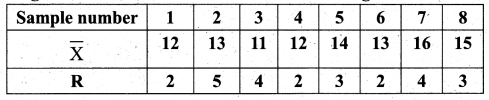
Solution:
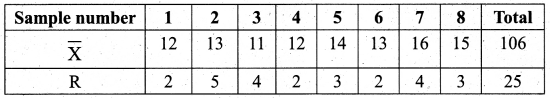
From the values of the control limits for \(\bar{X}\), we observe that sample \(\bar{X}\) value 16 is above the UCL. Hence we conclude that the process is out of control.
![]()
Question 21.
In a certain bottling industry, the quality control inspector recorded the weight of each of the 5 bottles selected at random during each hour of four hours in the morning.
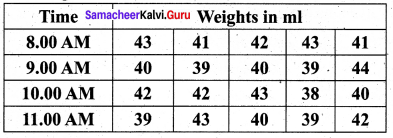
Solution:
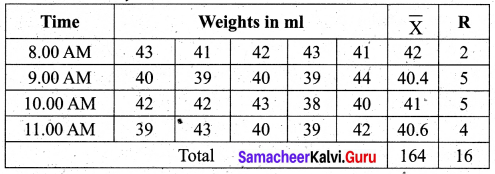
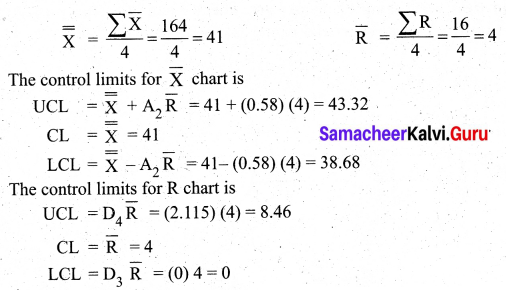
From the above control limit values. We observe that all the sample \(\bar{X}\) values are within UCL and LCL values. Also, all the R values are also within UCL and LCL of R chart. Hence we conclude that the process is within Control.